Have you heard of RespectAbility? When I went to their website, I found a COOL CHART showing some HOT NUMBERS: the best and worst states for people with disabilities who want to work.
Before you look at the chart (I’ve pasted it below):
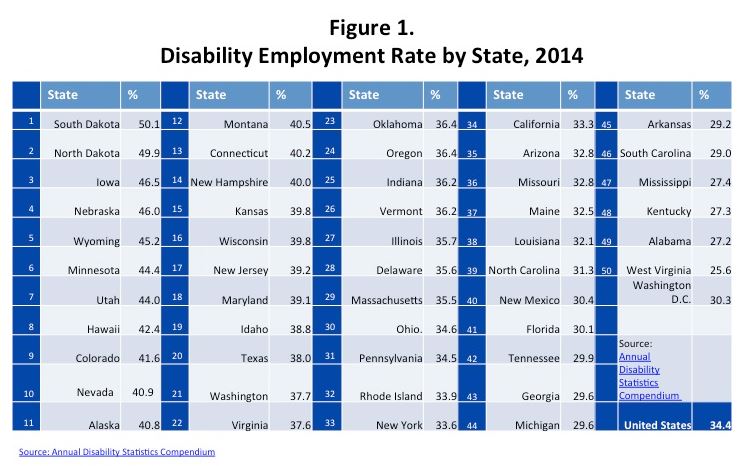
• Guess which state has the highest employment rate for people with disabilities – 50.1%? Do you think it’s a blue or a red state?
• Guess which state has the lowest rate – 25.6%? Is it blue or red?
• Answer: Almost all of the best AND the worst states for people with disabilities with regard to employment are in the red zone of the USA.
So, what else might be the reason for the differences between states? Hmmmmmmmm. Is it the underlying health of the state’s economy? I went to Mr. Google to find a ranked list of state economies. This list on Business Insider was the first one I found. Yay, here’s the answer, I thought (for a moment). The WORST state for people with disabilities is the LAST state in the ranking – the state with the weakest economy over all (West Virginia).
BUT then I noticed that two other states among the bottom 10 of Business Insider’s list of state economies are in RespectAbility’s the TOP FIVE for employment of people with disabilities: North Dakota and Wyoming. And at the other end, of the 10 states that Business Insider ranked most economically healthy, only 1 was also in RespectAbility’s top group for people with disabilities (South Dakota).
I started to wonder whether Business Insider’s list was the “right” one, and found three other lists, here, here, and here — all of which purported to describe the health of state economies. Each one has a VERY DIFFERENT RANKING of the states!! The difference seems to be the method they used: the underlying data sources and the formula used to calculate the results.
So I said uncle. As an economic babe-in-the-woods who is unable to sort through this stuff, I have given up my extremely short amateur quest to understand WHY some states are better places to be if you have a disability and want to work! For now, it is what it is, to use the jargon of today.
CLICK ON the table from RespectAbility pasted below and check out the numbers. Then go to the full article on the RespectAbility website to read their analysis of why the numbers look the way they do – and what it all means. And while you’re there, RespectAbility has also asked the current candidates for President of the USA to answer questions about their position on people with disabilities. Their answers were NOT all the same!
Really interesting Jennifer!